

Last updated: September 2026 (Figures verified against each cited source; this page is refreshed annually.)
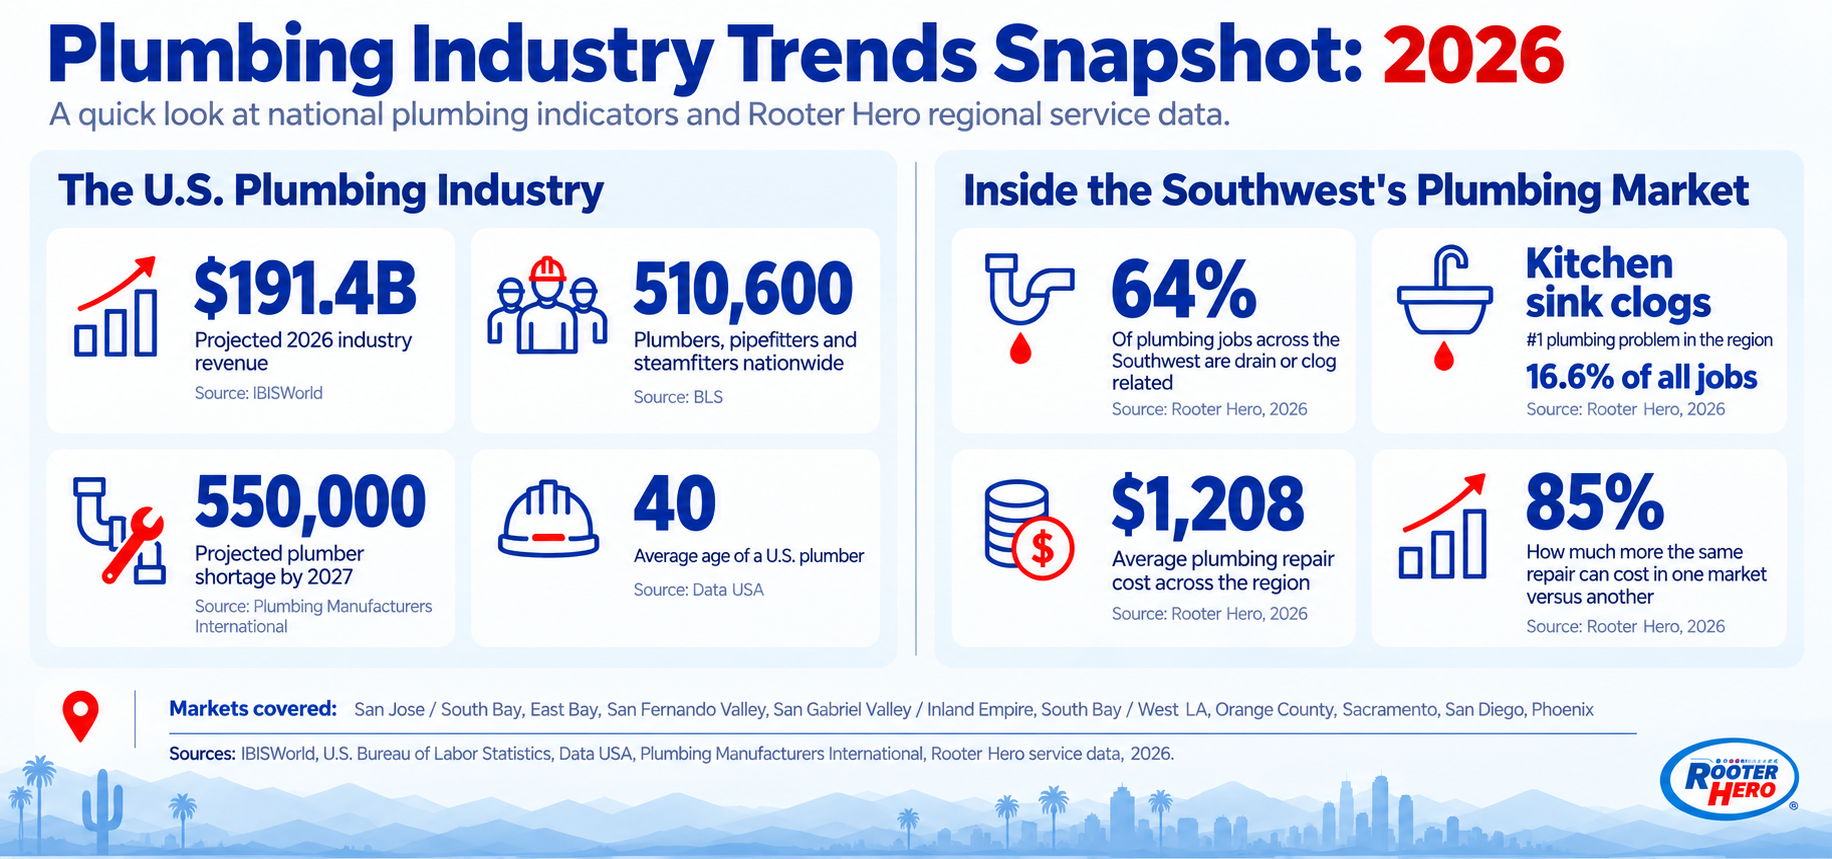

Plumbing is a bigger, more strained industry than most homeowners realize. A labor shortage is colliding with rising demand, costs vary more by region than most cost guides let on, and what actually breaks in a home depends heavily on climate and geography.
We pulled together the numbers that matter: how large the plumbing industry is, how many plumbers the country has (and needs), what's driving the biggest industry trends, and what actually breaks most often, backed by real service data from 9 markets across California and Arizona.
On this page:
Plumbing industry statistics: market size, business count, and workforce
How many plumbers the U.S. has, and how many more it needs
Plumber demographics and workforce age
Most common plumbing problems and repair costs
Plumbing trends and regional differences across the U.S.
Plumbing industry trends to watch in 2026
FAQ
U.S. Plumbing Industry Statistics
The plumbing industry is bigger, and more fragmented, than most people assume. It isn't dominated by a handful of national brands; it's built almost entirely on small, independent, local businesses.
The U.S. plumbing industry is projected to generate $191.4 billion in revenue in 2026 (IBISWorld, 2026). Revenue has grown at a compound annual rate of about 3.1% over the past five years, tracking closely with broader construction and facilities-maintenance spending.
There are roughly 129,000 plumbing businesses operating in the United States (IBISWorld, 2026). That's a highly fragmented market: most plumbing companies are small, local operations rather than national chains, which is part of why pricing and availability can vary so much from one city to the next.
The plumbing industry employs more than 742,000 people across the country (IBISWorld, 2026). The average plumbing business employs under 6 people, and this figure covers everyone working inside those businesses, not just licensed plumbers on trucks: apprentices, dispatchers, estimators, and office staff all count toward it.
How many plumbers are there in the U.S.?
Not everyone who works at a plumbing company is a plumber. Dispatchers, apprentices, sales staff, and office employees all show up in the industry-wide employment figure above, but only a fraction of them hold the job title of plumber, pipefitter, or steamfitter. The government tracks that narrower group separately, and it's the number most people actually mean when they ask how many plumbers are in the U.S.
The U.S. Bureau of Labor Statistics counts about 510,600 people working specifically as plumbers, pipefitters, and steamfitters nationwide (U.S. Bureau of Labor Statistics, 2025). That's the narrower, occupation-specific headcount, which is why it's smaller than the 742,000 industry-wide figure above.
Employment of plumbers, pipefitters, and steamfitters is projected to grow 7% from 2025 to 2035, faster than the average for all occupations (U.S. Bureau of Labor Statistics, 2025). That's a healthy growth rate on paper, but it says nothing about how many current plumbers are nearing retirement, which is where the industry's real staffing problem shows up.
How Many Plumbers Does the U.S. Need?
The plumbing trade has a math problem. Fewer people are entering it as apprentices than are leaving it through retirement, and that gap has been building for years. Two numbers show just how large it's gotten, and what it's already costing.
The U.S. is on pace to be short about 550,000 plumbers by 2027 (Plumbing Manufacturers International, 2026). That's roughly the size of the entire current plumbing workforce counted by the government, meaning the shortfall alone is nearly as large as the trade itself.
That shortage is already costing the U.S. economy an estimated $33 billion a year in delays and higher costs (John Dunham & Associates, 2026). Longer wait times for service and higher prices for homeowners and businesses alike are the most visible symptoms of that cost, and a major reason both vary as much as they do from one part of the country to another.
Plumber Demographics and Workforce Age
The shortage described above doesn't come out of nowhere, it shows up clearly in the age of the people currently doing the work. Plumbing skews older than many trades, and a meaningful share of the workforce is closer to retirement than to the start of their career. The numbers below show both where the workforce sits today and how much of it is aging out.
The average plumber in the U.S. is just over 40 years old: 40.6 for men and 39.2 for women (Data USA, 2025). That puts the typical plumber roughly a decade past the point most people enter the trade, reflecting how few younger workers are moving in behind them.
More than 1 in 5 plumbers nationwide is 55 or older (Data USA, 2025). That's a large enough share nearing retirement age to make the workforce gap described above a near-term problem rather than a distant one, since replacing those workers takes years of training most new entrants haven't started yet.
Plumbing Statistics from the Southwestern U.S.
California and Arizona include some of the most varied plumbing markets in the country: older, tree-lined neighborhoods with aging clay sewer lines, fast-growing desert suburbs with hard water and extreme heat, and everything in between. Rooter Hero operates across 9 of these markets (San Jose and the South Bay Area, the East Bay and North Bay, the San Fernando Valley, the San Gabriel Valley and Inland Empire, the South Bay and West Los Angeles, Orange County, Sacramento County, San Diego County, and the Phoenix metro area), and its records of more than 44,000 completed jobs and 11,000 customer calls offer a rare, granular look at what actually breaks in homes across the region, and how much it costs.
About 64% of plumbing jobs across the Southwest region are drain or clog related (Rooter Hero, 2026). That share varies widely by market: it's as low as 54% of completed jobs in the San Fernando Valley and as high as 73% in San Diego County.
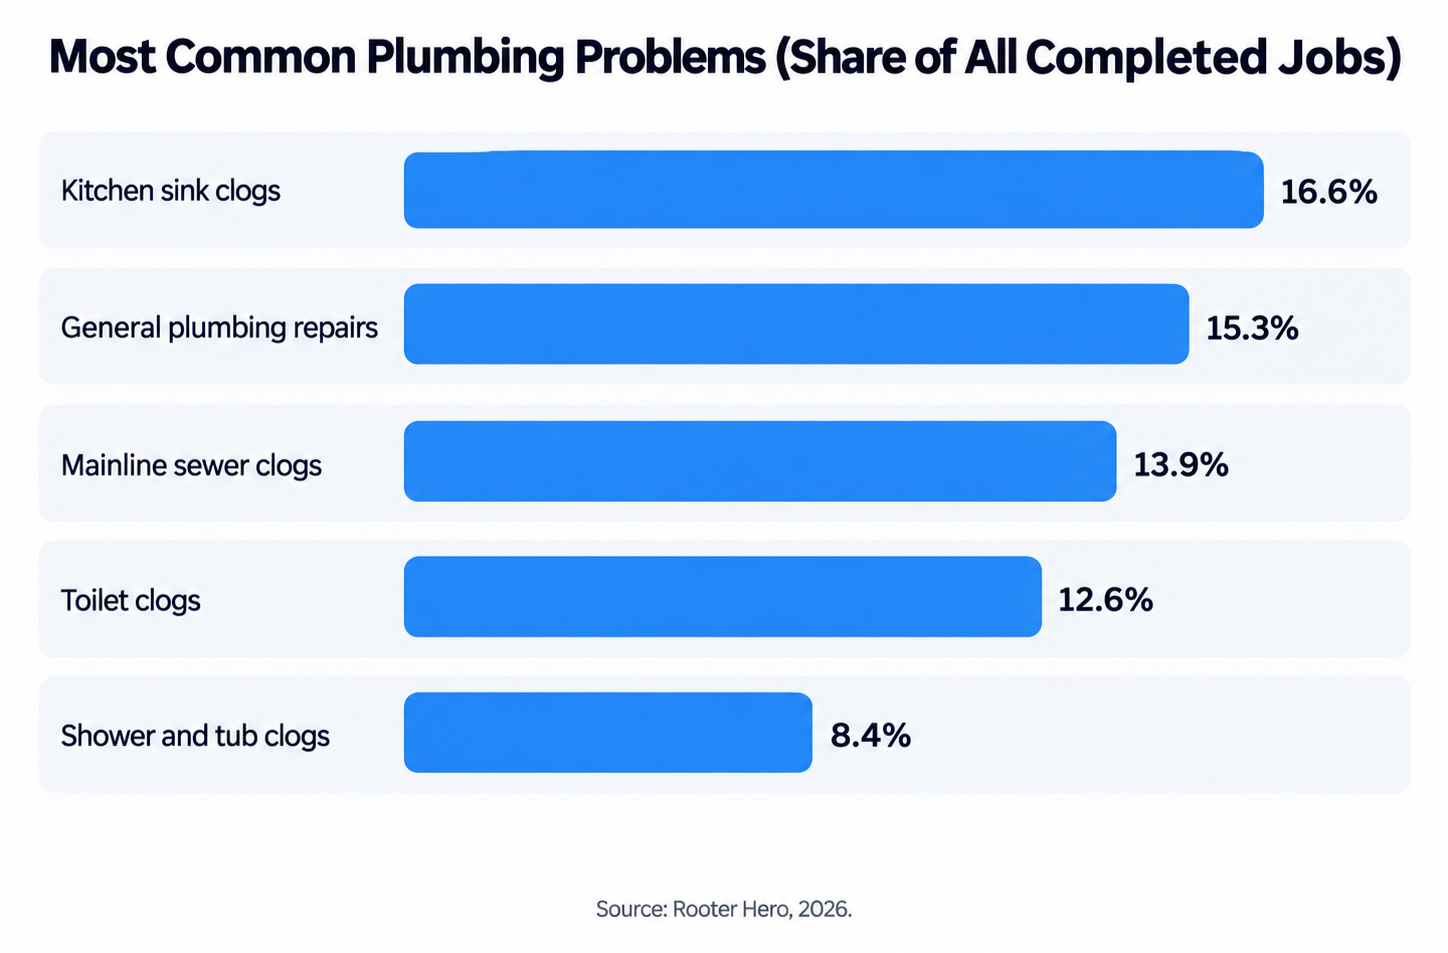
The 5 most common plumbing problems across the region are kitchen sink clogs (16.6% of all completed jobs), general plumbing repairs (15.3%), mainline sewer clogs (13.9%), toilet clogs (12.6%), and shower and tub clogs (8.4%) (Rooter Hero, 2026).
San Diego County has a higher concentration of kitchen sink clogs than any other market in the region, accounting for 20.9% of all completed jobs there (Rooter Hero, 2026), likely tied to the region's hard water accelerating grease and mineral buildup.
In the East Bay and Sacramento, mainline sewer clogs are the top plumbing issue, making up 18.0% and 16.0% of completed jobs respectively, a pattern tied to older clay sewer lines and mature tree root systems in both areas (Rooter Hero, 2026).
Water heater jobs (maintenance, replacement, and tankless installs) make up about 3% of plumbing jobs across the region, and water leak calls (inside the home and in the yard) make up about 5% (Rooter Hero, 2026). Both categories are smaller in volume than clogs, but cost more per job on average. Water heater maintenance is notably more common in the Inland Empire and San Gabriel Valley (3.3% of completed jobs) than elsewhere, consistent with harder water and older housing stock accelerating wear on tanks and fixtures.
Emergency Calls, Timing, and Cost
Not every plumbing problem waits for business hours, and how often it does depends heavily on where you live. Emergency response needs, weekend demand, and repair costs all shift by market, and the gaps between the highest and lowest markets are bigger than a single regional average would suggest.
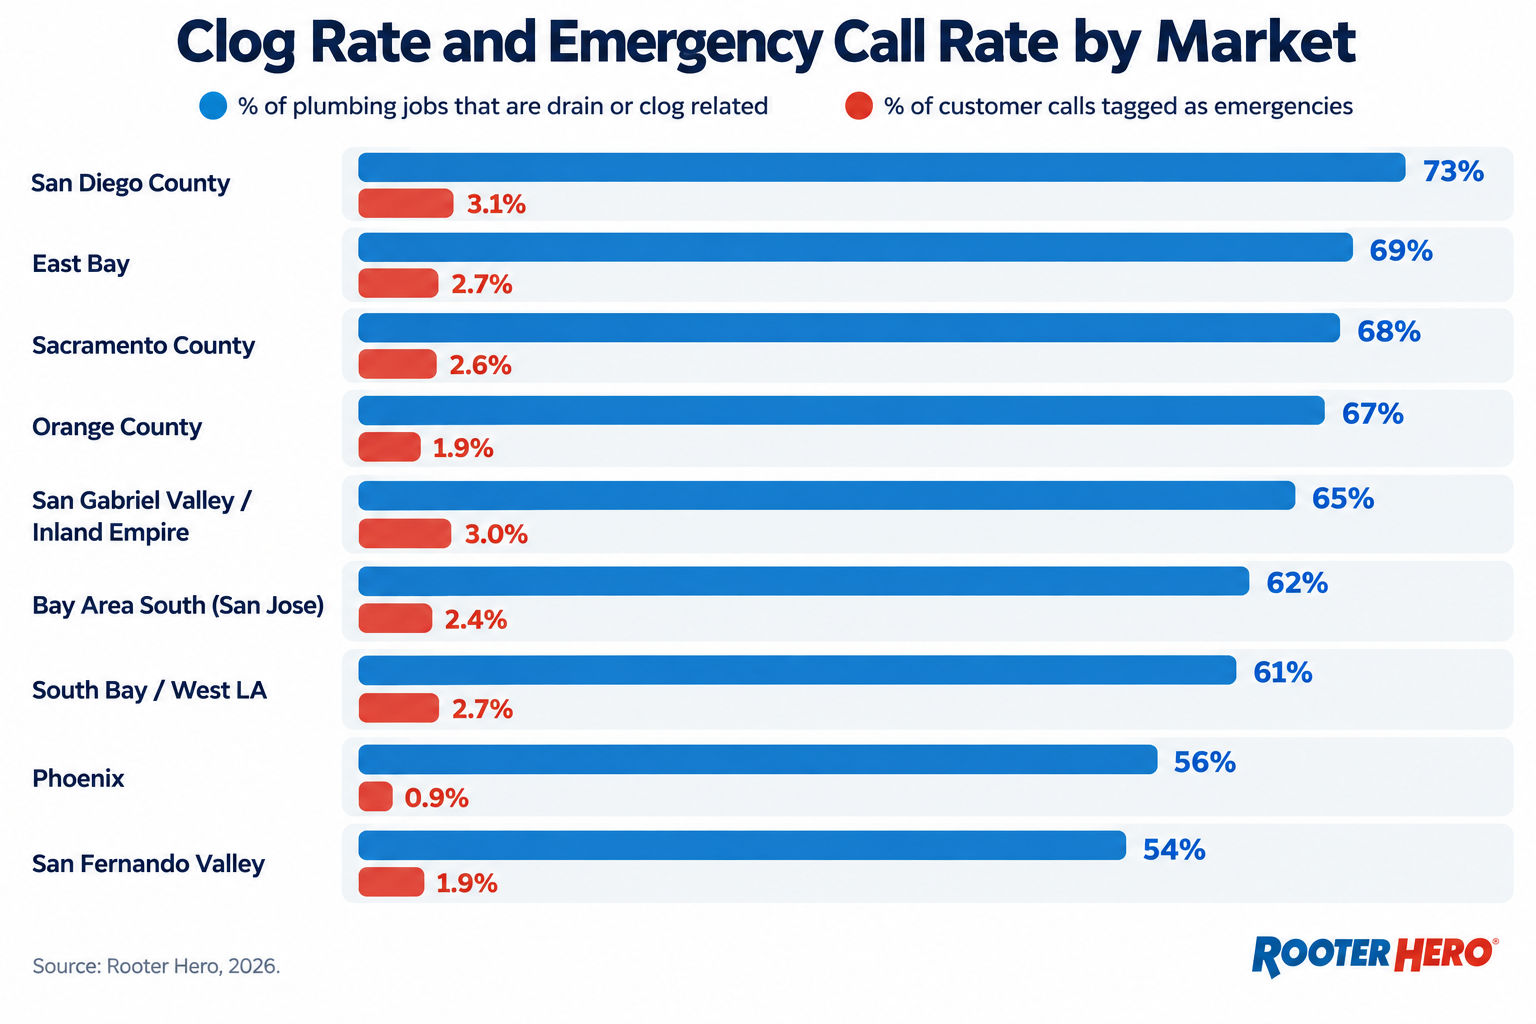
Emergency calls are far from evenly distributed across the region. Emergency-tagged calls range from just 0.9% of tracked inquiries in Phoenix to 3.1% in San Diego County (Rooter Hero, 2026). After-hours calls, between 9pm and 7am, show an even wider gap: 9.3% of all tracked calls in the Inland Empire, compared with just 1.6% in the San Fernando Valley and Sacramento, nearly a six-fold difference between the highest and lowest markets.
Weekend demand follows a similar pattern. Weekend calls make up 19.3% of tracked inquiries in San Diego County, versus just 6.4% in the East Bay (Rooter Hero, 2026), a difference large enough that a plumbing company's staffing needs really do shift market by market rather than following one regional average.
The average plumbing repair across the region runs $1,208 (Rooter Hero, 2026). The most expensive job categories are full pipe repiping ($2,053 average), emergency plumbing ($1,753 average), and water heater replacement ($1,594 average), all well above the cost of a typical clog or drain call.
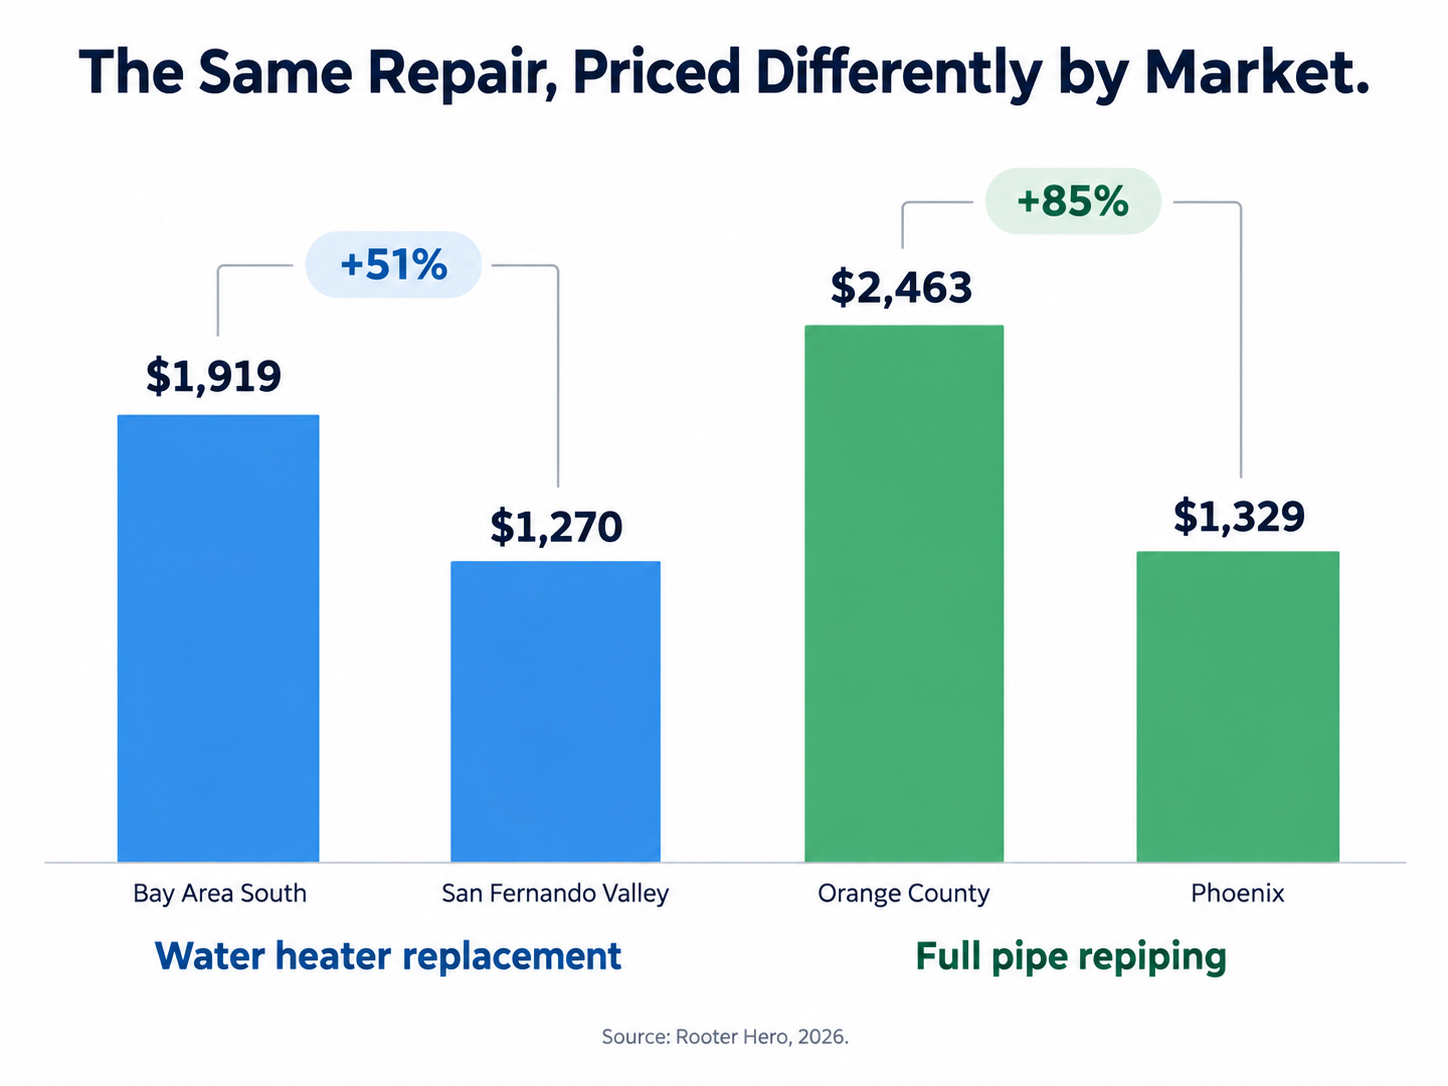
The same repair can cost dramatically different amounts depending on the market. A water heater replacement averages 51% more in the Bay Area than in the San Fernando Valley. A full repiping job averages 85% more in Orange County than in Phoenix (Rooter Hero, 2026). Local labor costs, permitting, and material access all factor in, but the size of that spread is bigger than most national cost guides account for.
For context, national plumbing repair costs typically run $150 to $500 for standard jobs, with slab leaks, sewer line repairs, and burst pipes averaging $1,600 to $3,500 (Angi, 2026; HomeAdvisor, 2026). The average repair cost above sits within that national range, but the market-to-market spread tells a story national averages miss entirely.
Plumbing Trends and Regional Differences Across the U.S.
Plumbing problems are not the same everywhere. Climate, soil, and water hardness all change what actually breaks in a home, and that holds true both nationally and within the specific markets Rooter Hero serves.
In the Northeast and parts of the Midwest, frozen and burst pipes are a defining winter risk. From 2024 through mid-2025, State Farm alone paid out more than $628 million on over 20,000 frozen pipe and winter water damage claims, averaging about $15,400 per claim (State Farm, 2025).
In the South and parts of Texas, expansive clay soil makes slab leaks a bigger regional risk. Over 95% of new homes in the West South Central states and nearly 80% of new homes across the South are built on concrete slabs, and the same soil that expands and contracts with rain and drought puts direct stress on the pipes running underneath them (Groundworks, 2026, citing National Association of Home Builders data).
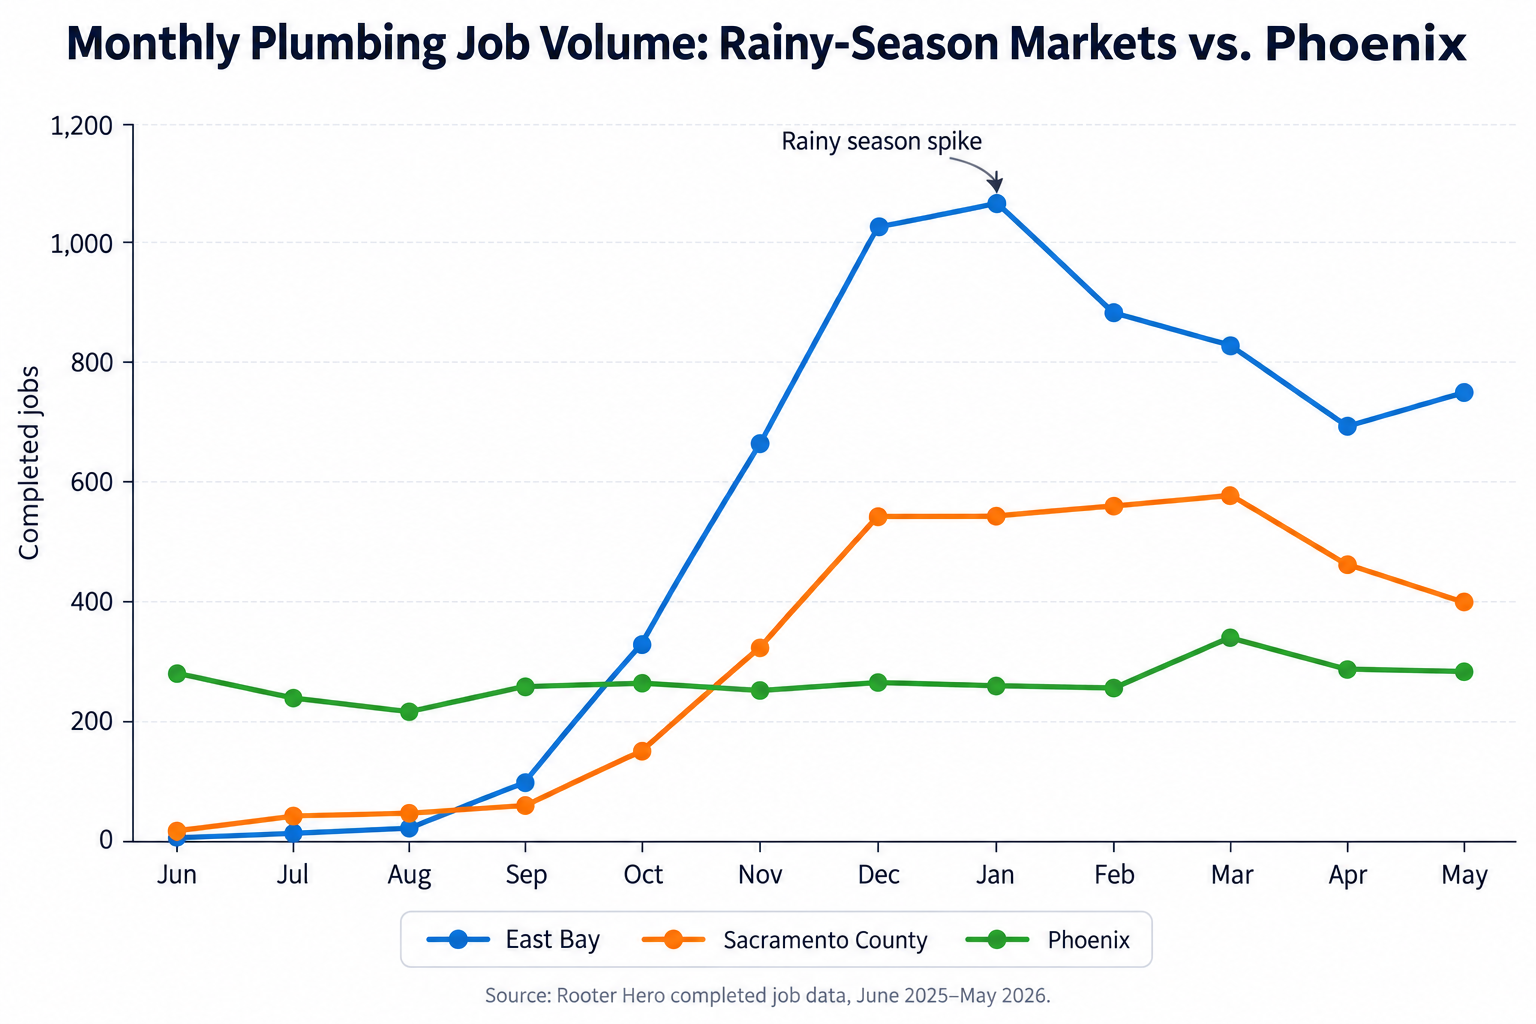
In markets with a defined rainy season, mainline sewer clog volume can more than triple between summer and winter. In the East Bay, completed jobs climbed from just 18 in August to 1,029 in December and 1,063 in January, as seasonal rain and tree root intrusion overwhelm older clay sewer lines. Sacramento shows the same pattern, climbing from 39 jobs in August to 575 in March (Rooter Hero, 2026).
In drier, milder markets, demand barely moves with the seasons. Phoenix's job volume stayed within a narrow band of 216 to 339 jobs a month all year, with extreme heat and hard water driving demand instead of rain. Orange County and the South Bay/West LA area show similarly flat, stable demand year round (Rooter Hero, 2026).
Plumbing Industry Trends to Watch in 2026
These are the broader shifts shaping the plumbing trade nationally, based on the workforce, cost, and technology data above, plus the regional patterns seen across the Southwest.
Labor shortage and an aging workforce. As covered above, this is the single biggest structural trend in the industry: fewer new plumbers entering the trade than are retiring out of it, pushing up wait times and prices in many markets (Plumbing Manufacturers International, 2026; Data USA, 2025).
Smart water technology adoption. Leak-detection sensors, automatic shutoff valves, and whole-home water-usage monitors are becoming common upsells, and increasingly, insurance-driven requirements, aimed at catching small leaks before they become the $1,600 to $3,500 slab leak or sewer line repairs that show up in national cost data (Angi, 2026).
Regional climate is a bigger driver of demand than most homeowners realize. Plumbing call volume in Northern California markets swings dramatically with the rainy season, while call volume in drier climates like Phoenix and Orange County stays nearly flat year round. National data backs up the broader pattern: cold-climate regions see winter spikes tied to frozen pipes, while clay-soil regions in the South see more slab leak activity (Rooter Hero, 2026; State Farm, 2025; Groundworks, 2026).
Rising material and labor costs are compressing margins. Typical plumbing companies run 10-18% net profit margins, with top performers reaching 18-22%+ mainly through recurring revenue like maintenance memberships, while the industry-wide average sits well under that. Material cost inflation and the labor shortage above are the two biggest pressures on that margin (Profitability Partners, 2026).
Frequently Asked Questions
How many plumbers are there in the United States?
The U.S. Bureau of Labor Statistics counts about 510,600 people working as plumbers, pipefitters, and steamfitters nationwide. Looking at the whole plumbing industry rather than just that job title, IBISWorld estimates more than 742,000 people work across roughly 129,000 plumbing businesses (BLS, 2025; IBISWorld, 2026).
How many plumbers does the U.S. need?
The country is on pace to be short about 550,000 plumbers by 2027, a shortage already costing the U.S. economy an estimated $33 billion a year (Plumbing Manufacturers International, 2026).
What is the average age of a plumber?
The average plumber in the U.S. is just over 40 years old (40.6 for men, 39.2 for women), and more than 1 in 5 plumbers is 55 or older (Data USA, 2025).
What is the biggest trend in the plumbing industry right now?
The labor shortage is the biggest structural trend, alongside growing adoption of smart water technology like leak sensors and automatic shutoff valves that catch problems before they turn into major repairs.
What is the most common plumbing problem?
Kitchen sink clogs are the single most common plumbing call across the Southwest region, followed by general plumbing repairs, mainline sewer clogs, and toilet clogs. About 64% of all completed jobs are drain or clog related in some way (Rooter Hero, 2026).
How much does a plumbing repair cost on average?
Most plumbing repairs nationally run $150 to $500, though bigger jobs like slab leaks, sewer line repairs, or burst pipes average $1,600 to $3,500 (Angi, 2026). The average plumbing repair across the Southwest region runs $1,208, and the same repair can cost up to 85% more or less depending on the market (Rooter Hero, 2026).
Do plumbing problems change with the seasons?
Yes, and the pattern depends heavily on climate. In Northern California markets, like the East Bay and Sacramento, mainline sewer clogs spike from November through March (Rooter Hero, 2026). In drier, milder markets like Phoenix and Orange County, call volume stays relatively flat all year. Nationally, cold-climate regions like the Northeast see a similar winter spike tied to frozen pipes instead of clogs (State Farm, 2025).
Methodology
National industry statistics (market size, business counts, workforce figures, demographics, and regional trends outside the Southwest) are drawn from the sources listed above, each reflecting the most recently published data available as of September 2026.
Completed-job statistics reflect a 12-month period ending May 2026. Customer engagement statistics (emergency, after-hours, weekend, and cost figures) reflect a separate 12-month period ending September 2026. Both cover the same 9 markets in California and Arizona. This page will be refreshed annually.
Sources
IBISWorld, Plumbers in the US: Market Size
IBISWorld, Plumbers in the US: Number of Businesses
IBISWorld, Plumbers in the US: Employment Statistics
U.S. Bureau of Labor Statistics, Occupational Outlook Handbook: Plumbers, Pipefitters, and Steamfitters
Data USA, Plumbers, Pipefitters, and Steamfitters
Plumbing Manufacturers International and John Dunham & Associates, via Plumbing & Mechanical magazine
State Farm Newsroom, Frozen Pipes? Not So Nice!
Groundworks, How Plumbing Leaks Impact Concrete Slab Foundations (citing National Association of Home Builders data)
HomeAdvisor, Plumbing Cost Estimates
Profitability Partners, Plumbing Profit Margins
Rooter Hero, proprietary service and job data across its 9 California and Arizona markets (see Methodology above)